Transit
Transaction > Transit displays all the JDBC and WebRequest data currently stored by FusionReactor. These graphs are a combination of both the Activity Graph and the Time Graph.
In the top right of the page next to Set Home Page, switch graphs quickly by clicking the WebRequest drop down and selecting JDBCRequest, this works both ways. In addition, switch between different metrics by clicking on the drop down labelled Both.
You can view the following:
| Name | Description |
|---|---|
| Type Selector | Select the type of transaction to graph. |
| Historic/ Active | Choose either the historic values of the active values. |
| Time / Activity | Choose either the run time average series or the count series for the selected type. |
[
Note
Having the run time average and activity series on the same graph can result in a graph that is difficult to read. This occurs as the request activity is generally much smaller than the run time of the pages.
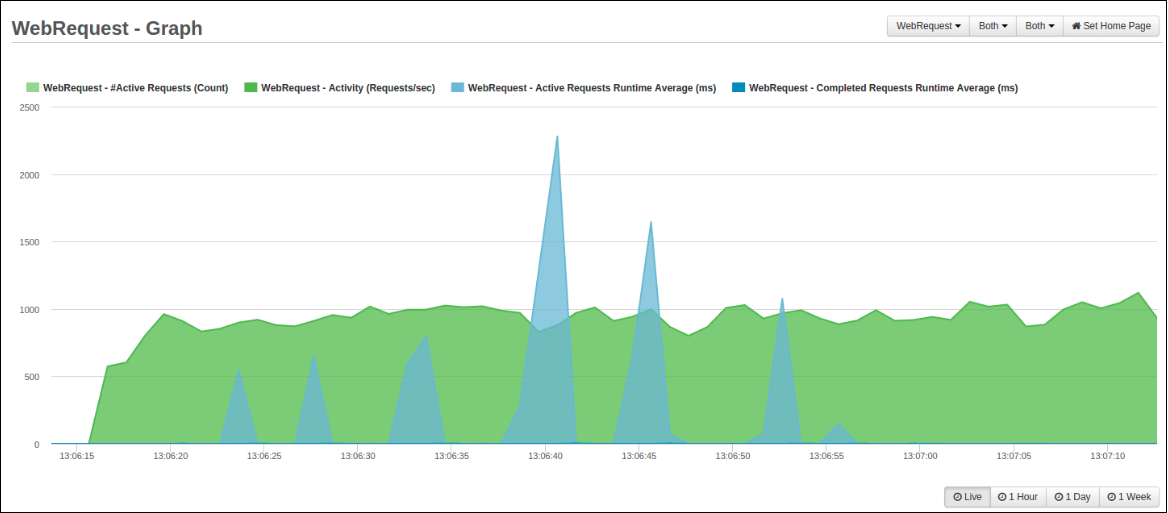
WebRequest Graph
Several time spans are available, with differing resolutions. These will be filled as data points are collected by FusionReactor.
Each time varying graphs shows four independent values overlaid:
WebRequest - #Active Requests ( Count ) | Light Green
This graph provides insight into the server request activity; if the number of active transactions stays high and constant then your database is under load.
WebRequest - Activity (Requests/sec ) | Green
This is the number of web requests transactions completed per second since the previous sample on the graph in green, and the number of transactions running at the time the sample is taken.
WebRequest - Active Requests Runtime Average (ms) | Light Blue
The average execution time of active execution of all active requests at the point the sample is taken.
WebRequest - Completed Requests Runtime Average (ms) | Blue
The average execution time of completed web requests since the previous sample on the graph.
Deselect and reselect each independent value by clicking on their respective names, when a value is deselected (greyed out) then that value is no longer displayed on the graph.
Placing your mouse pointer on a data point within the graph shows a tool-tip with details about that sample, including:
- Date and time of the request
- Activity (requests / sec)
- Active Request Runtime Average (ms)
- Active Requests (count)
- Completed Request Runtime Average (ms)
Tip
When browsing the 1 Hour, 1 Day, and 1 Week activity graphs, select time frames by using the slider under the graph to pinpoint specific days, times and spikes in your Web Requests.
JDBCRequest Graph
Several time spans are available, with differing resolutions. These will be filled as data points that are collected by FusionReactor.
Each time varying graphs shows two independent values overlaid :
JDBCRequest - #Active Requests (Count) | Light Green
This graph provides insight into the JDBC Transaction activity; if the number of active transactions stays high and constant then your database is under load.
JDBCRequest - Activity (Requests/sec) | Green
This is the number of JDBC transactions completed per second since the previous sample on the graph in green, and the number of transactions running at the time that the sample is taken.
JDBCRequest - Active Requests Runtime Average (ms) | Light Blue
This graph provides insight into the JDBC Transaction performance; if the average execution time of the active JDBC transactions continues to increase it could be that some database transactions are hanging.
JDBCRequest - Completed Requests Runtime Average (ms) | Blue
The average execution time of the completed JDBC transactions since the previous sample on the graph, and the
average execution time of active JDBC transactions at the point that the sample is taken.
Deselect and reselect each independent value by clicking on their respective names, when a value is deselected (greyed out) then that value is no longer be displayed on the activity graph.
Placing your mouse pointer on a data point within the graph shows a tool-tip with details about that sample, including:
- Date and time of the request
- Activity (Requests / sec)
- Active Request Runtime Average (ms)
- Active Requests (Count)
- Completed Request Runtime Average (ms)
Tip
When browsing the 1 Hour, 1 Day, and 1 Week activity graphs, select time frames using the slider under the graph to pinpoint specific days, times and spikes in your JDBC Requests.
Need more help?
Contact support in the chat bubble and let us know how we can assist.