Explore
Find it: FusionReactor > Explore
Explore allows you to query and analyse all metrics, logs and traces ingested to your cloud account. Create new data views and filter data in any way you require.
Warning
While with Explore you can technically search for any amount of data within your cloud account, there are strict execution times on queries that will restrict performance heavy queries.
Datasource selection
Within Explore there are three datasource configures. They are accessed using the dropdown located to the left of the screen. The default datasource is Metrics.
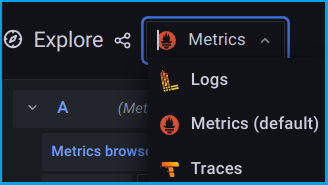
- Metrics will contain any metric sent from a FusionReactor agent, plus some additional metrics created within our ingest engine.
- Traces will contain any slow or error transactions sent from a FusionReactor agent, requests viewed in the recent or running tabs of the server view will not appear here as they are not ingested.
- Logs will contain any logs sent to FusionReactor, either from a FusionReactor agent or log shipper.
Note
Going forward we will allow ingest for traces and metrics from a non FusionReactor agents, however at this time this feature is unavailable.
Metric queries
🔎Find it: FusionReactor > Explore > Metrics
To explore metrics, use the Metric browser.
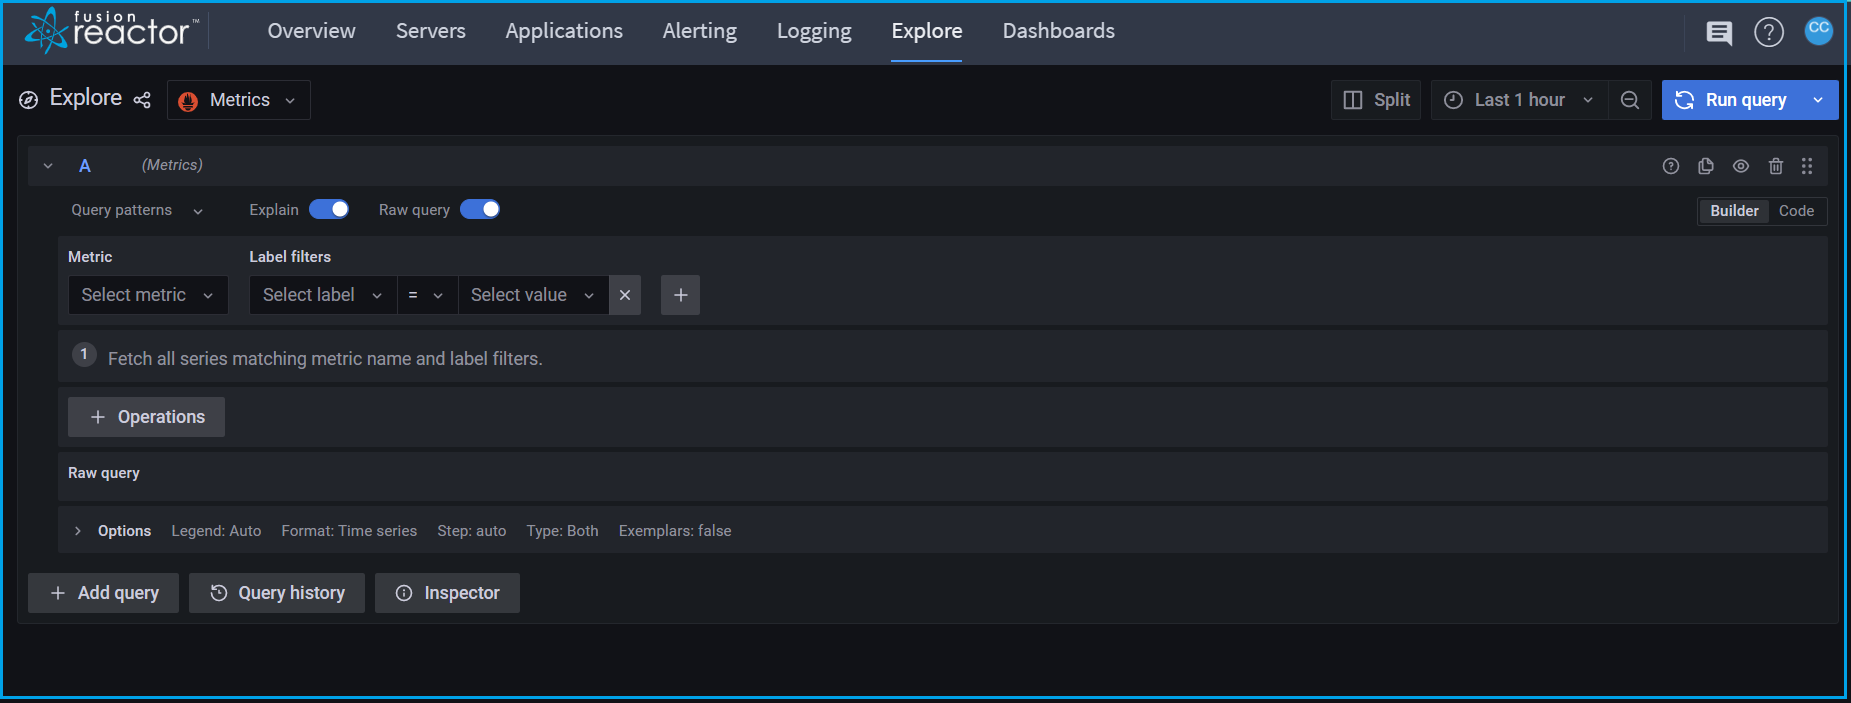
Within the Metric browser you can:
- Select one or more metrics to view.
- Filter metrics by any label, such as instance, group or application.
- Execute functions such as Sum, Count, or Avg on metrics.
- Compare metrics by using mathematical functions.
- Combine multiple queries in a single view.
- View data as various chart types, or as raw data in a table.
The metrics browser will create data views for you using Promql.
Using Promql directly you can create powerful and complex queries to get the most out of your FusionReactor data.
Trace queries
🔎Find it: FusionReactor > Explore > Traces > Search
To explore traces we advise using the Search feature.
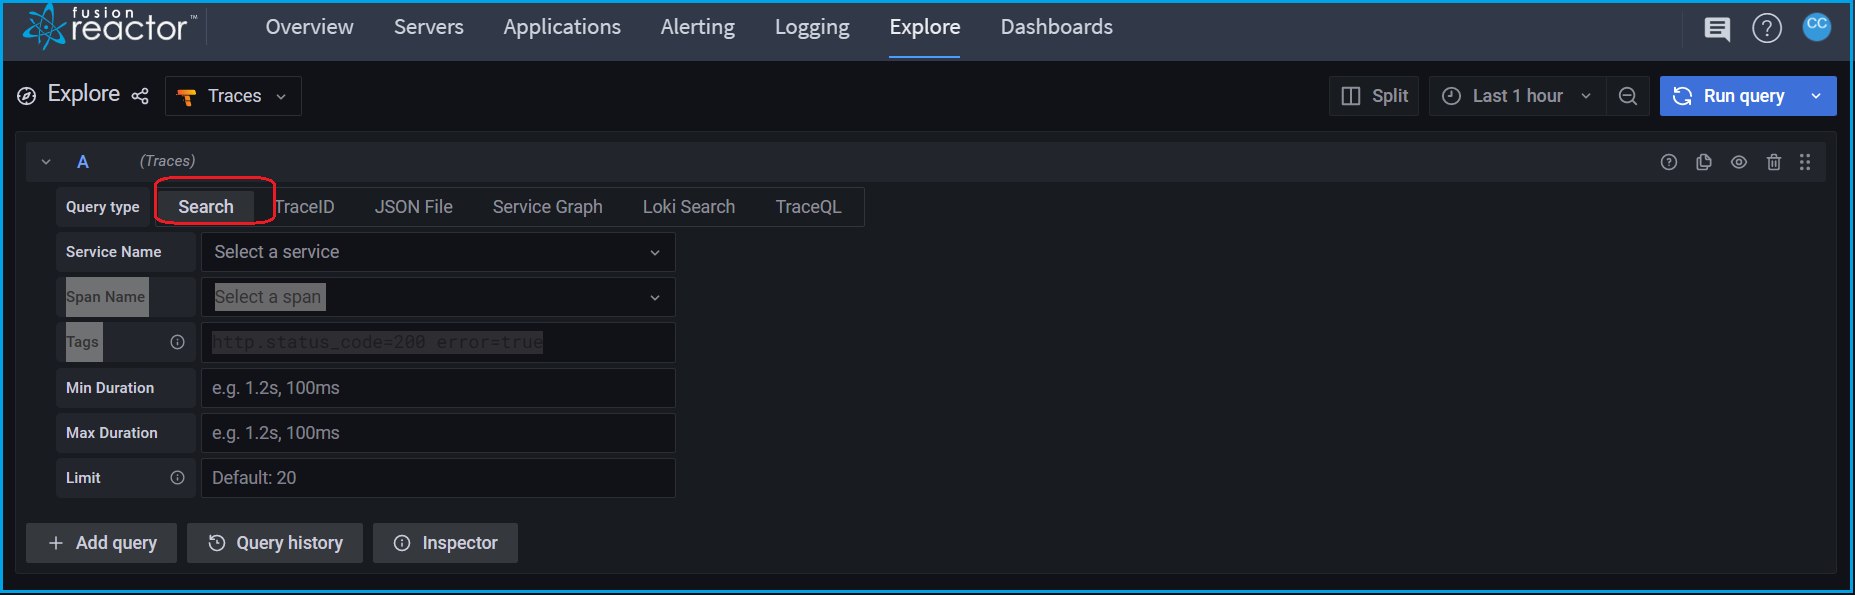
Within search, you can specify:
| Type | Description |
|---|---|
| Service Name | Instance from which the trace originates. |
| Span Name | The URL or action of a transaction. |
| Tag | A label applied to a trace, for example txnId or status.code. A full list of tags can be searched within the input field. |
| Min Duration | The minimum duration of a transaction. |
| Max Duration | The maximum duration of a transaction. |
| Limit | How many results you wish to view. |
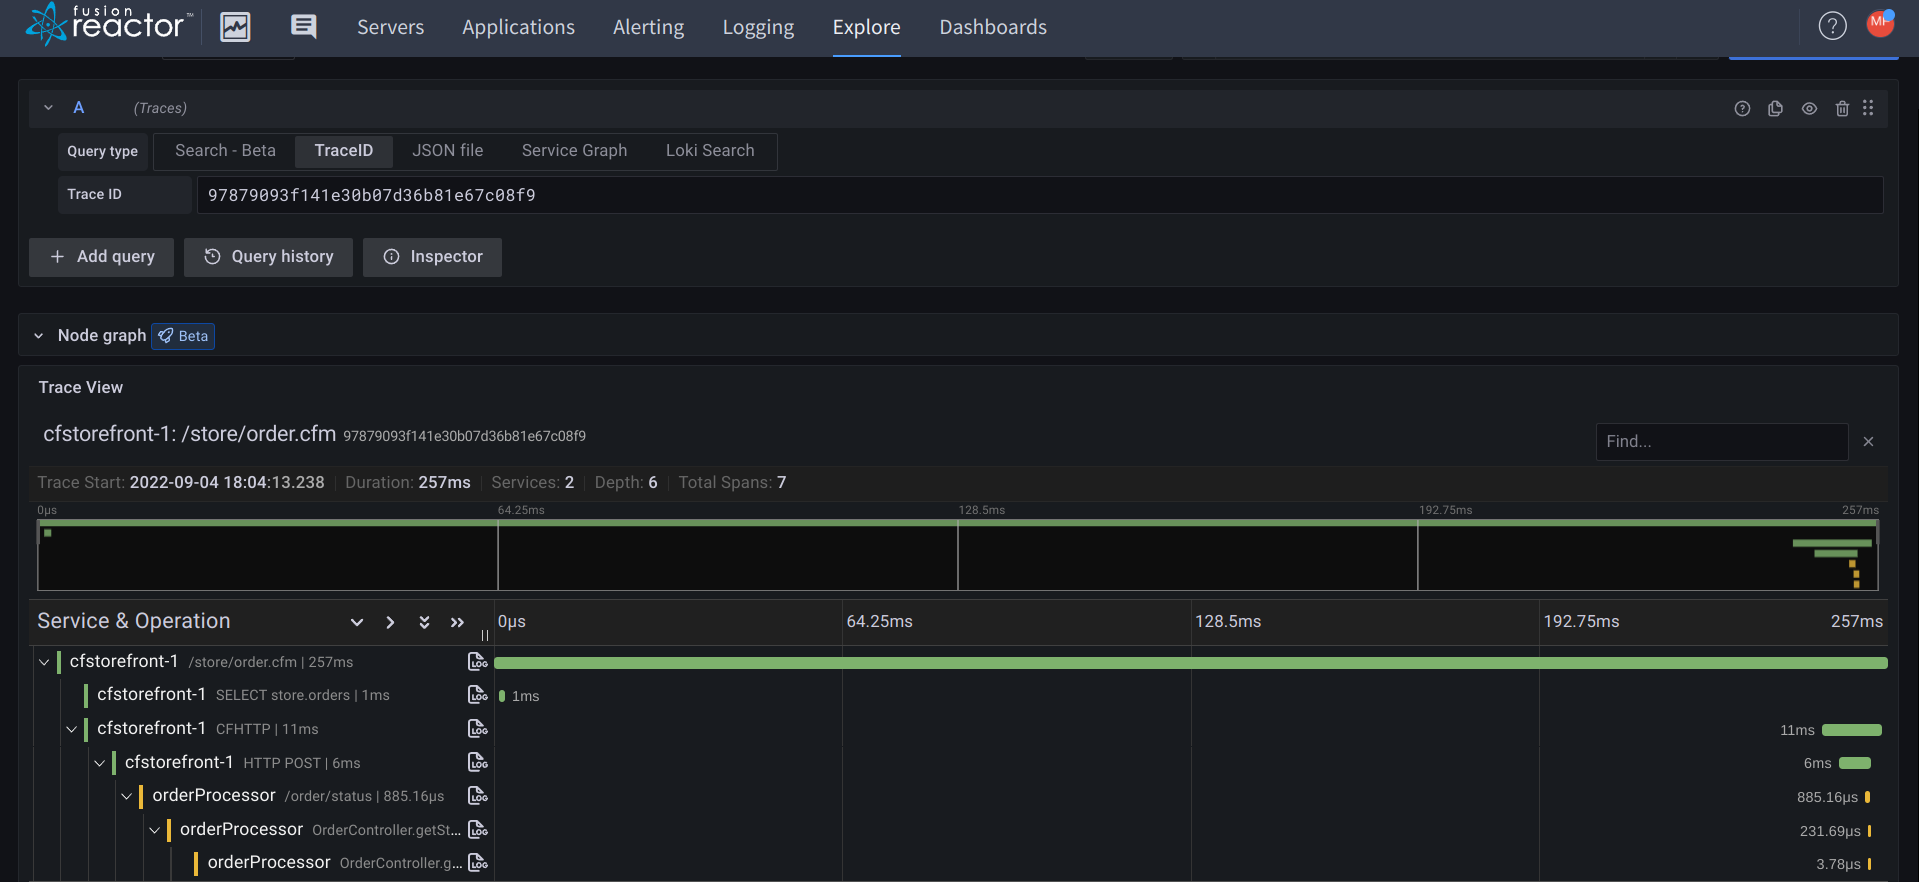
You can view the trace information by clicking on the trace ID, which will open a window on the right of the screen.
Log queries
🔎Find it: FusionReactor > Explore > Logs
To explore logs, use the Logs browser.
The Logs browser allows you to filter and view any ingested logs.
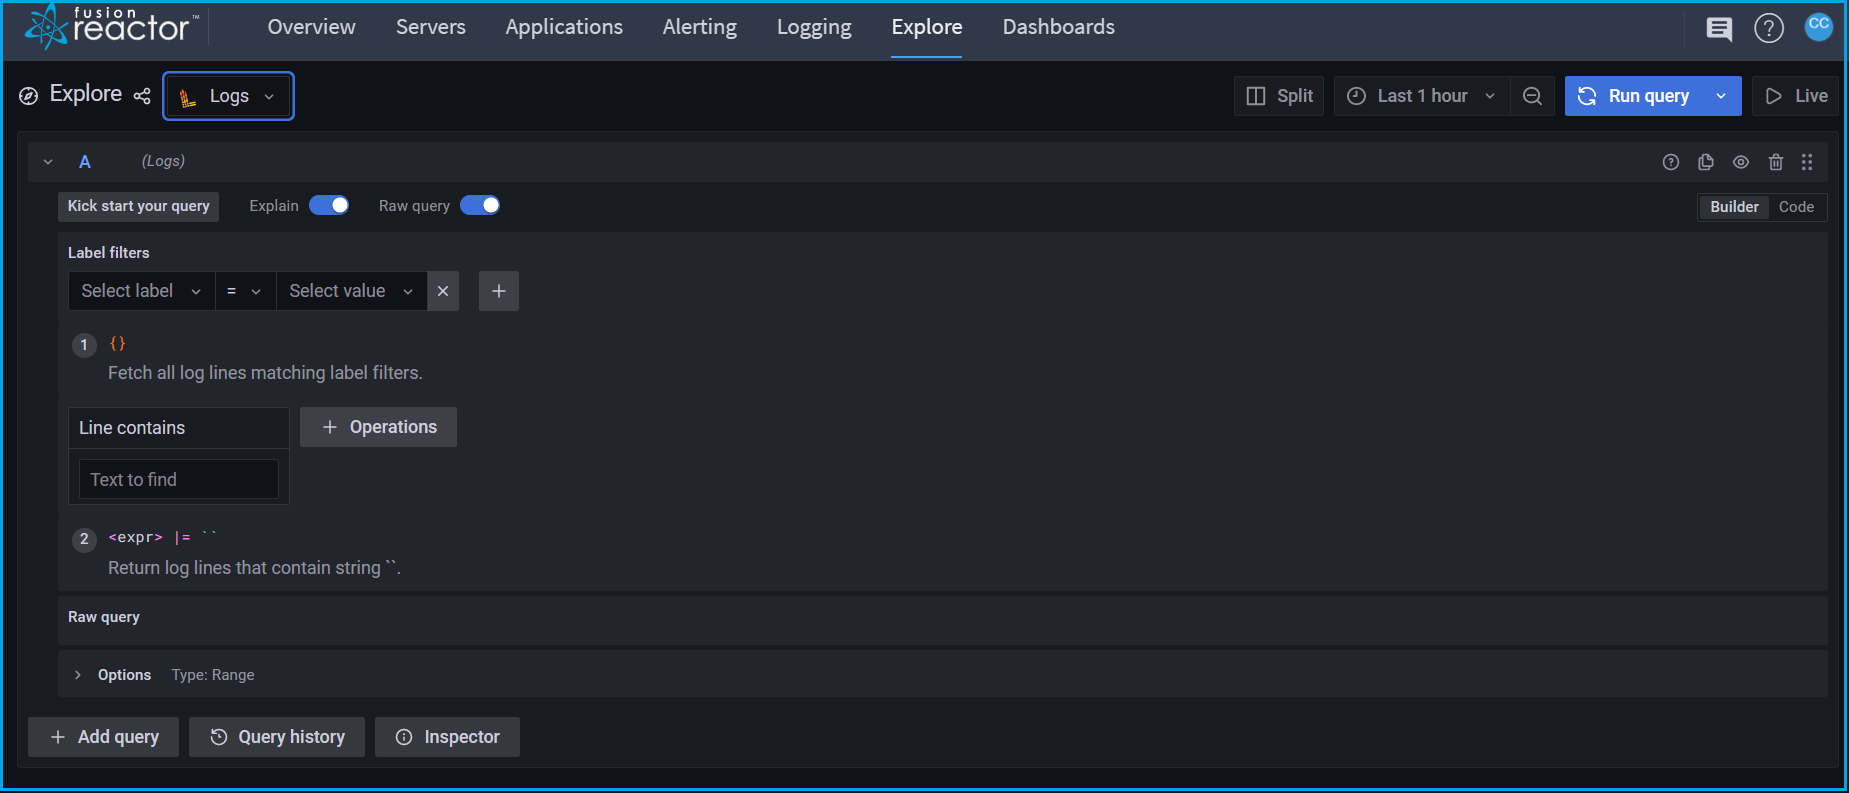
Within the log browser you can:
- Filter logs by any label, such as job, filename or instance.
- Execute functions such as Sum, Count, or Avg on logs to extract metrics from logs themselves.
- Combine multiple queries in a single view.
- View data as various chart types, or as raw data in a table.
The log browser will build log queries for you and automatically generate LogQL
You can also use Explore to run your own LogQL queries not built using the browser.
LogQL is a query language developed by Grafana labs. It allows you to filter and search across your log content and can also generate metric data based on your log data.
LogQL examples
Search for logs with a specific job
Example
{job="job1"}
Search for specific filename
Example
{filename=~"request"}
Search for logs with a job using wildcard
Example
{job=~"job.*"}
Search for any stdout or stderr logs for any jobs matching the wildcard
Example
{job=~"job.*",filename=~"std.*"}
Query for the volume of jobs per job and instance
Example
sum(count_over_time({job=~".+"}[5m])) by (job,instance)
Query for the top IP addresses triggering requests in FusionReactor
Example
topk(10,sum by (clientAddress)(rate({filename="request"} | logfmt | line_format "{{.clientAddress}}" | __error__="" [1m])))
Query nginx for the top IP address hitting the load balancer
Example
topk(10,sum by (remote_address)(rate({filename="/opt/access.log"} | logfmt | line_format "{{.remote_address}}" | __error__="" [1m])))
Search all logs for the text exception
Example
{ job=~".+"} |= "Exception"
Process the request log for top hit page URLs
Example
sum by (url)(rate({filename="request"} | logfmt | line_format "{{.url}}" | __error__="" [10s]))
Graph the number of error or exception error lines
Example
sum by (job) (count_over_time({job=~"store-.*"} |= "error" != "exception" [5m]))
Process the avg CPU time per page URL
Example
topk(10, sum by (url)(avg_over_time({ filename="request"} | logfmt | __error__="" | unwrap cpuTime[5m])))
Graph previous crashes caused by OutOfMemory errors
Example
sum by (job) (count_over_time({job=~".+"} |= "java.lang.OutOfMemory" [1m]))
Need more help?
Contact support in the chat bubble and let us know how we can assist.