Linkage in Grafana
Traces make up just one of the three pillars of observability.
- Metrics are generally the What is going wrong?
Example
A high rate of error logs or non-2xx response status codes.
- Traces are the Where?
Example
Requests between certain services taking a long time or certain trace paths often resulting in errors.
- Logs are the Why? - they contain messages describing the errors and why they occurred.
With this in mind, the ability to quickly correlate the three provides a significant reduction in the amount of time required to identify and diagnose issues.
Logs to traces
Logs can be linked to their corresponding traces via a trace ID, provided the log includes one as a field.
 |
|---|
| Loki settings allowing linkage to Tempo spans via a trace ID field. |
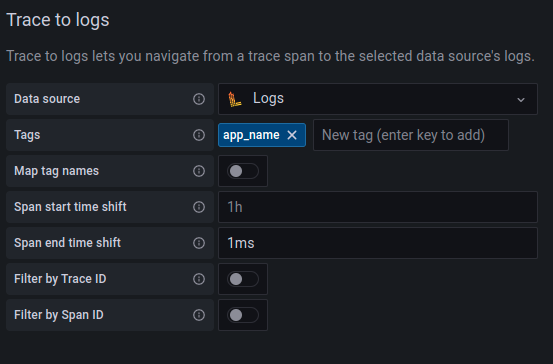
Traces to logs
Traces can be linked to potentially relevant logs by matching a span's attributes to a log's labels.
Example
Transaction logs (request.log, transaction.log and fr-exception.log) are logged with an app_name label. Use this to show logs that occurred within a specific application during a span's duration.
 |
|---|
Tempo settings allowing linkage to Loki via an app_name tag. |
Application name inconsistency
Sometimes logs occur at times when a transaction's application name is not known and the log is tagged with the default application name, MyApplication. This is typically the 'Executing' log message in request.log.
Need more help?
Contact support in the chat bubble and let us know how we can assist.