Metrics Page
This Metrics page is very similar to the Web Metrics page. One difference however, is the ability to filter the Request graphs to display a single transaction flavor.
This is useful when monitoring your own group of requests through combination with the FusionReactor API (FRAPI).
This page includes the following content:
| Name | Description |
|---|---|
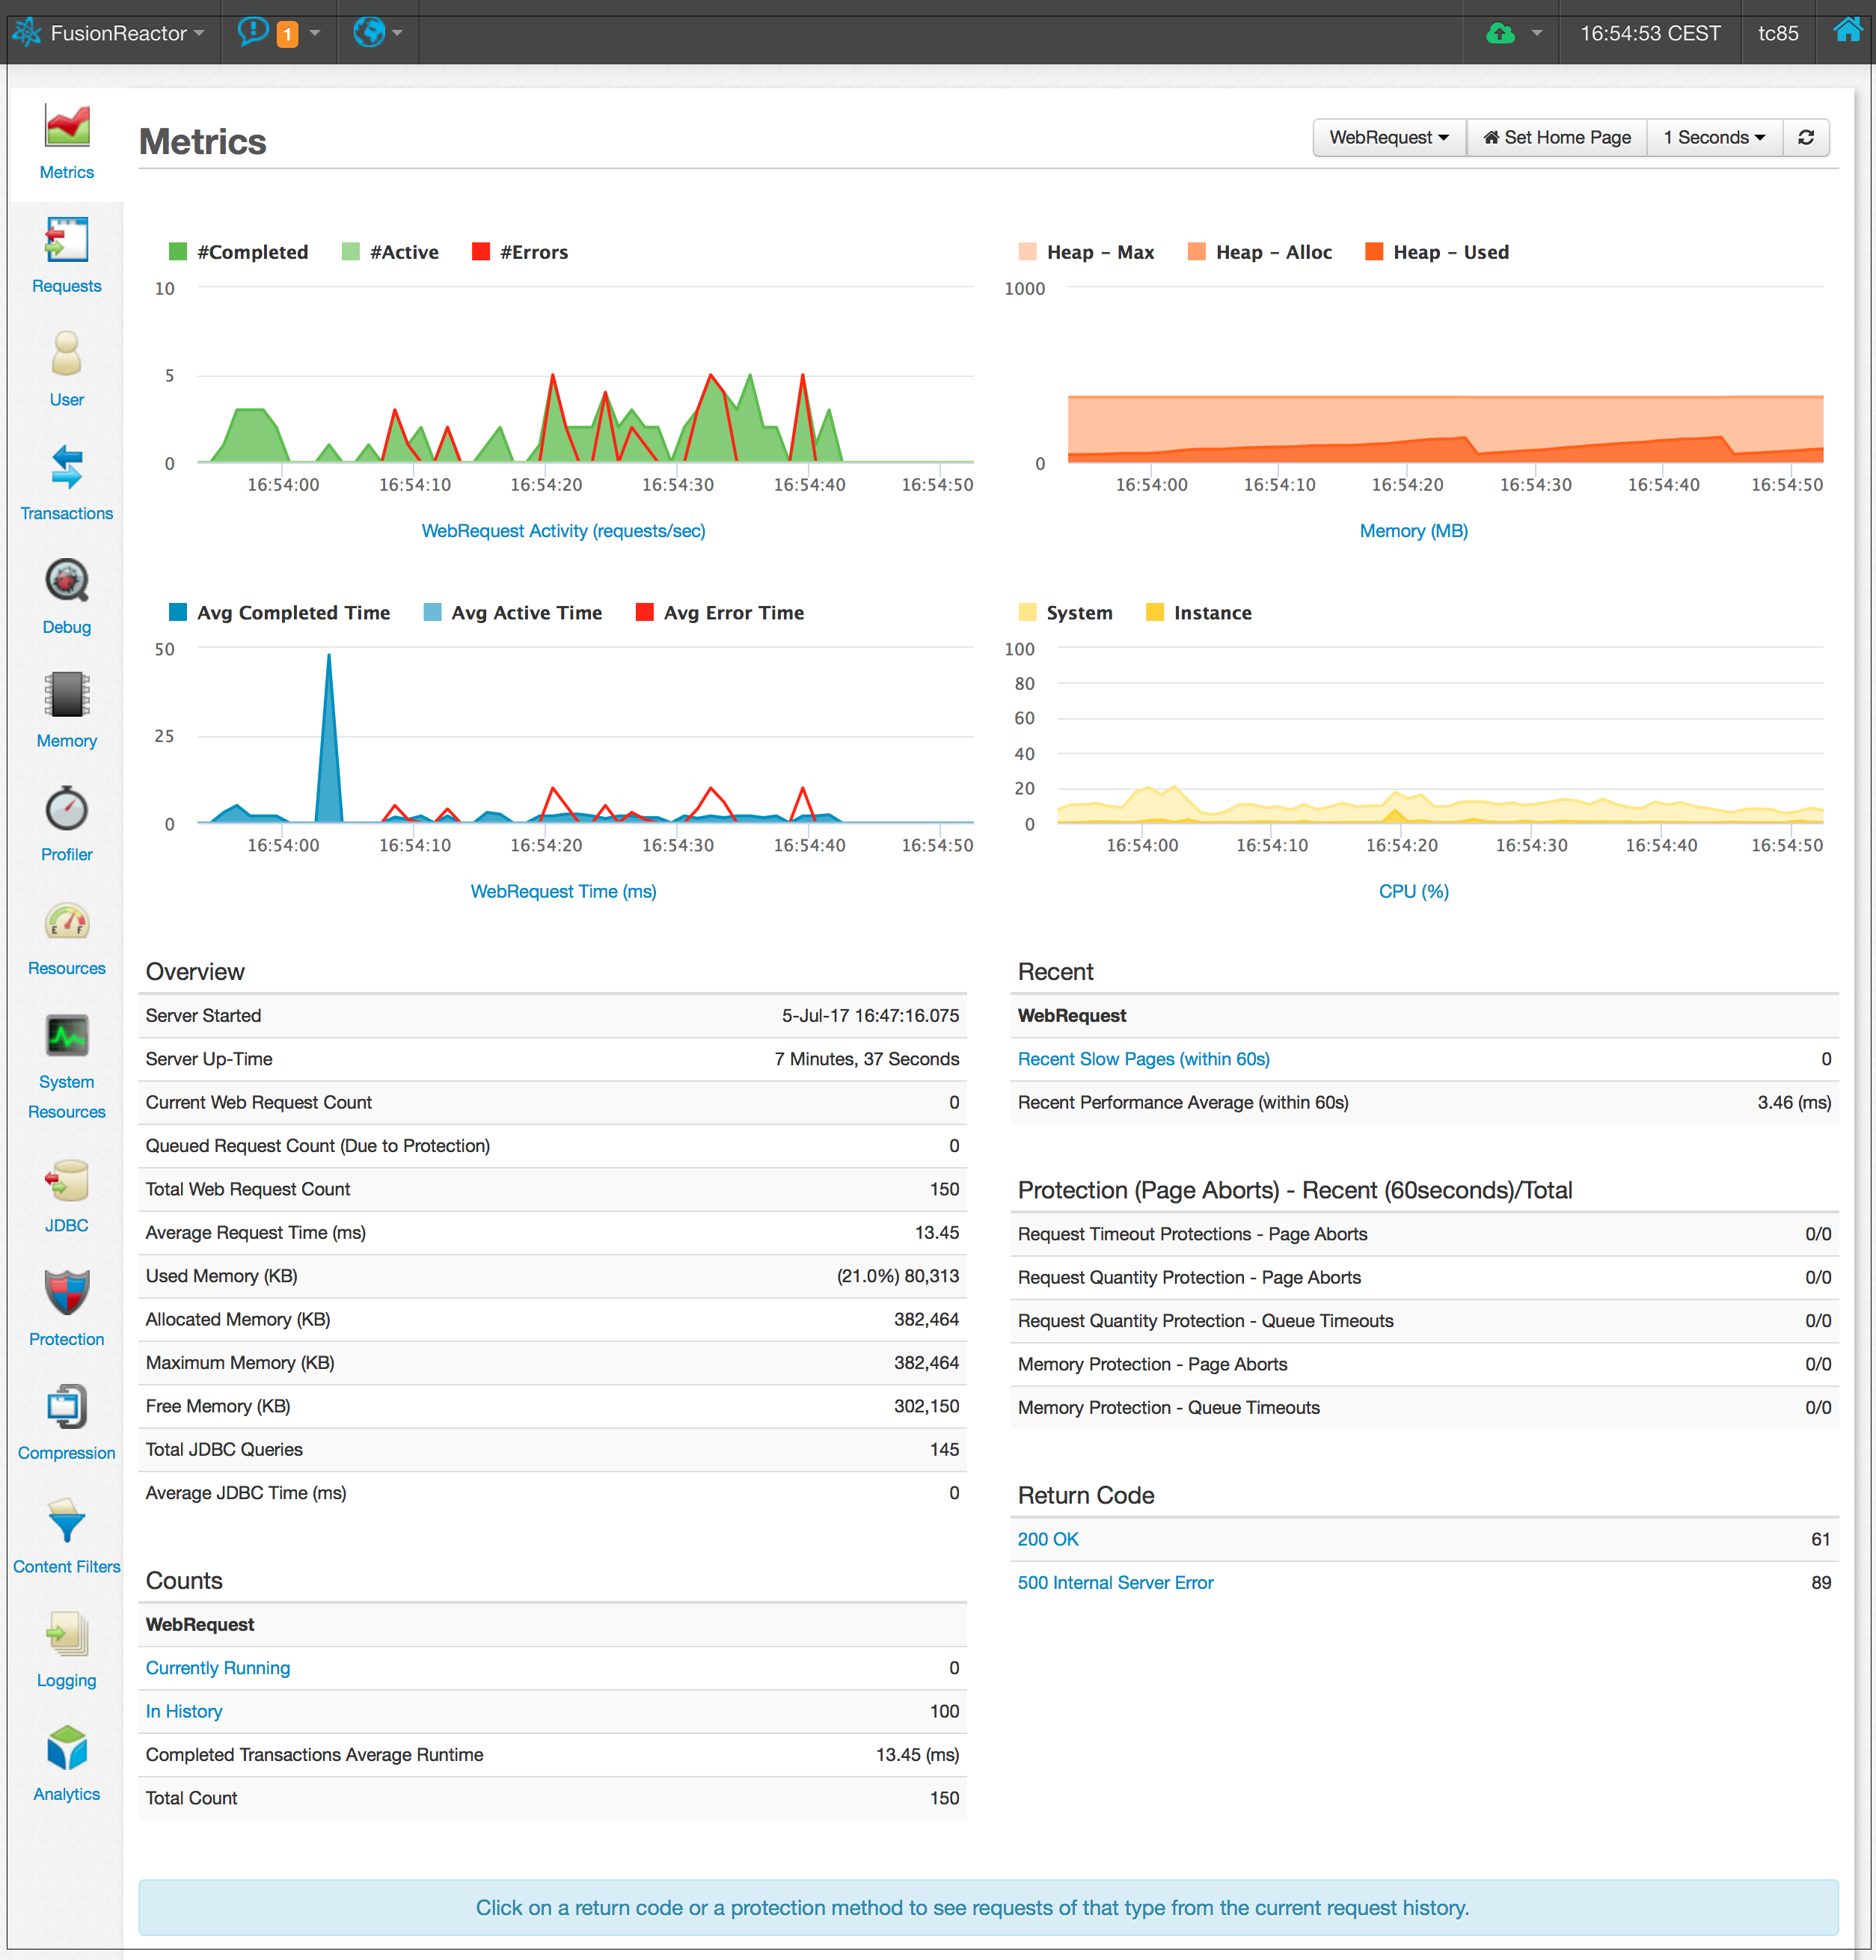
| Graphs | Here you can see 4 graphs: Request Activity, Request Time, Memory, and CPU. Click on any graph title to see an enlarged version; this will navigate you to a new page. The number and time of Errors for web requests is also tracked. |
| Overview | This section shows general statistics about this server. |
| Counts | This section contains an overview of the request type which you are currently monitoring. Note: The In History value is how many of this type are currently held in the history, not how many have run. |
| Recent | This section shows statistics about actions which have occurred on this server within the last 60 seconds for the monitored request type. The Recent Slow Pages link shows you all requests from the current request history which ran longer than the slow page threshold (defined on the Request Settings page). |
| Protection (Page Aborts) | This section shows how many pages have been aborted due to each of the three types of Protection. Clicking on the various Protection types displays all requests from the current request history which were aborted for that reason. |
| Return Code | This section lists all HTTP return codes which have been returned by this server. Each return code is also a link which will show you all requests from the current request history which have that return code. |
Need more help?
Contact support in the chat bubble and let us know how we can assist.