User guide
Anomaly Detection feature in FusionReactor Cloud
Monitoring an application is essential for delivering a high-quality product and ensuring a positive user experience. However, merely gathering a multitude of application metrics doesn't address the core issue. What software companies truly require is a mechanism to derive actionable insights from their metrics, enabling them to promptly address any issues their users may encounter.
Enter the RED method.
This new feature enhances observability by enabling users to track the probability of anomalies in critical service metrics, known as RED (Request, Errors and Duration rates). RED not only allows for closer monitoring of these key metrics but also provides notifications when they exceed set thresholds, offering a more proactive approach to service management.
Core metrics: The RED framework
Central to FusionReactor Cloud's new anomaly detection feature are the RED metrics:
| Metric | Description |
|---|---|
| Requests | Measures the rate at which requests are made to your services. |
| Errors | Tracks the occurrence and type of errors within your services. |
| Duration | Records the time taken for each service request to complete. |
Functionality of Anomaly Detection
| Function | Description |
|---|---|
| Gathering data | For each service, FusionReactor Cloud conducts three additional Prometheus queries to collect data on RED metrics. |
| Anomaly analysis | The time series data from these metrics is examined using an 'iforest' algorithm, which excels in calculating the likelihood of anomalies in the latest RED data. |
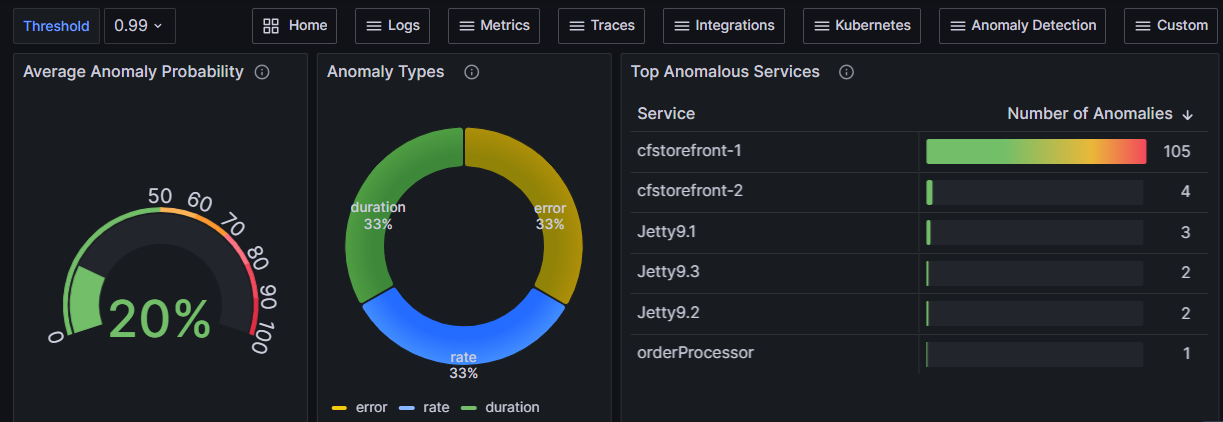
| Data display | Grafana dashboards are available for users to observe both the RED metrics and their anomaly probabilities. |
Configurable alert system
FusionReactor Cloud allows you to set up alerts for anomalies detected in your system, providing an opportunity to proactively manage and mitigate potential service issues.
Target audience
This documentation is intended for technical users and managers who are involved in the observability of their systems. Users are not required to have domain-specific knowledge in anomaly detection to use FusionReactor Cloud's anomaly detection features effectively, as the system is designed with a focus on user-friendliness and intuitive controls.
Enabling Anomaly Detection
Accessing the Anomaly Detection configuration
To enable anomaly detection in FusionReactor Cloud, follow these steps:
Step 1: Use your web browser to navigate to the Alerting page in FusionReactor Cloud.
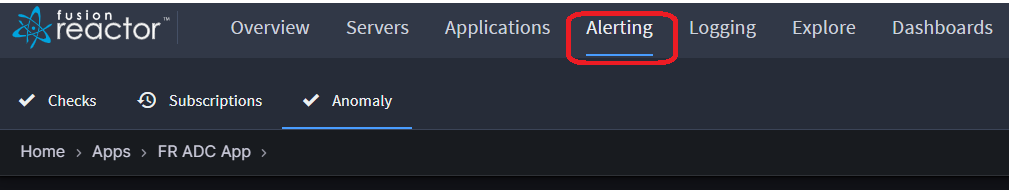
Step 2: Select the Anomaly Detection tab to access the Anomaly Detection configuration page.
Info
FR Cloud automatically detects your services and lists them on the Anomaly Detection configuration page.
To configure anomaly detection for each service:
| Setting | Description |
|---|---|
| Enable/Disable Anomaly Detection | Toggle anomaly detection on or off for each listed service. |
| Manage subscriptions | Choose one or more subscriptions to determine where alerts for detected anomalies will be sent. |
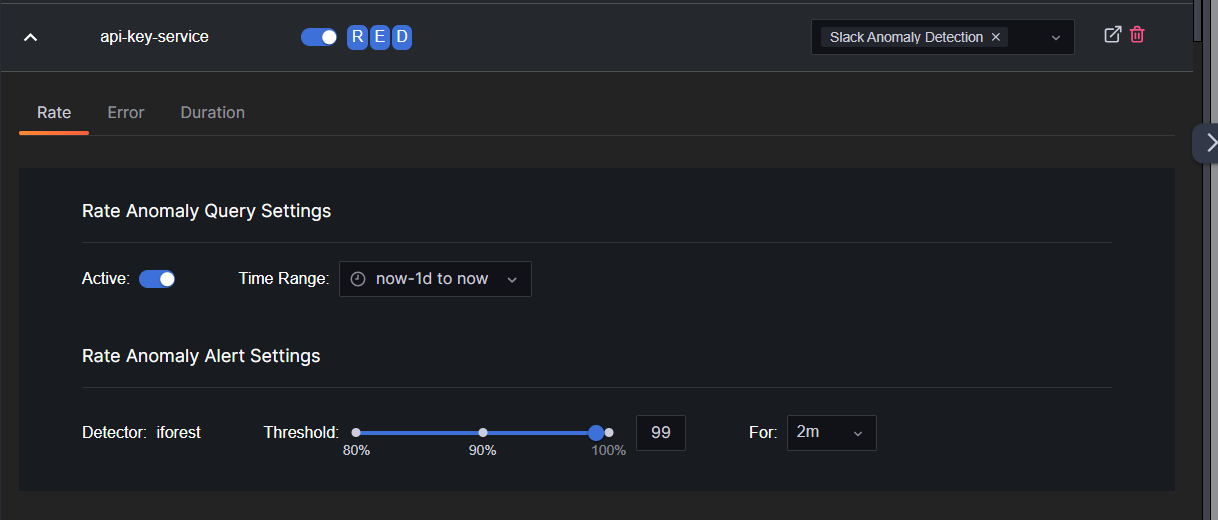
Detailed RED query settings
By expanding a service row, you can access and adjust settings for the RED metrics:
| Setting | Description |
|---|---|
| Active | Activate or deactivate anomaly detection for Rate, Error, and Duration queries individually. |
| Time Range | Choose the span of historical data for calculating anomaly probabilities for new data points. The time range can be set from one hour up to one week prior to the current time. This selected period functions as a rolling window, where new data points continuously replace the oldest ones. |
| Threshold | Tailor the sensitivity of the anomaly detection system by specifying a probability threshold. The typical range for this setting is between 80% and 100%, allowing you to define how the system identifies potential anomalies. |
| For (duration) | Establish the time period during which the predefined threshold must be surpassed for an anomaly to be officially reported. This setting allows you to determine how long an anomaly must persist before it triggers a report. |
Here is an example screen shot illustrating the configuration interface:
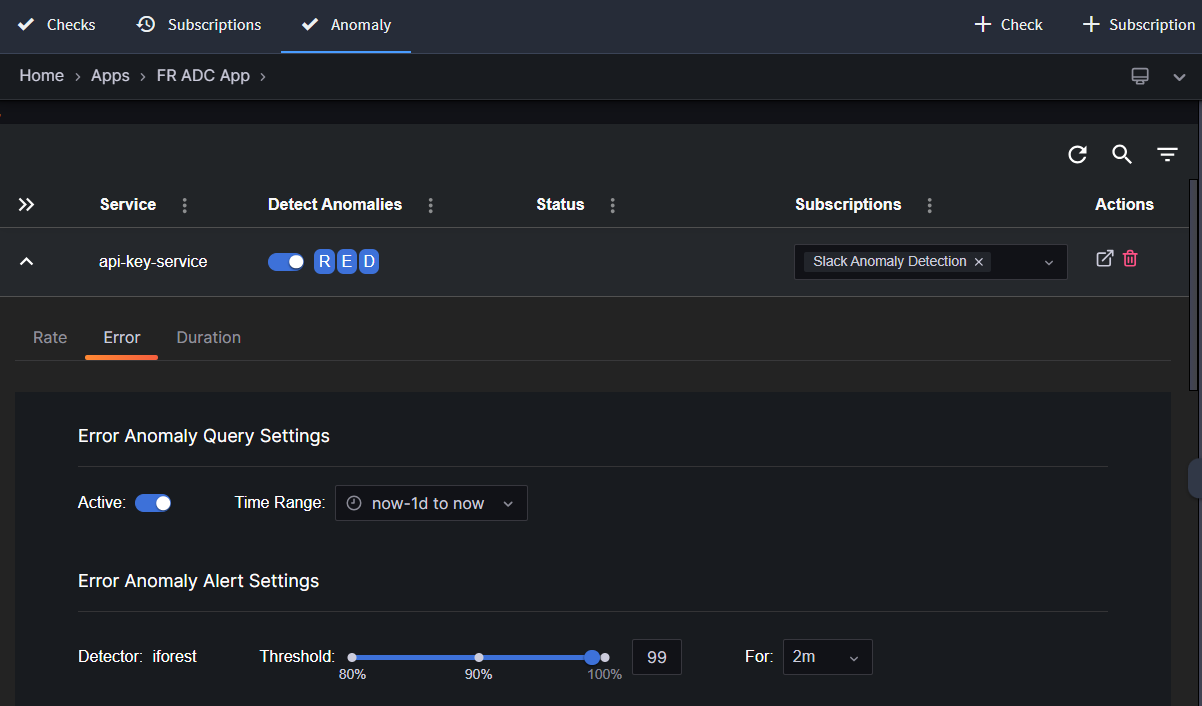
Note
The actual interface may vary slightly, and you should consult the latest version of FR Cloud for the most up-to-date information.
Configuring Anomaly Detection for services
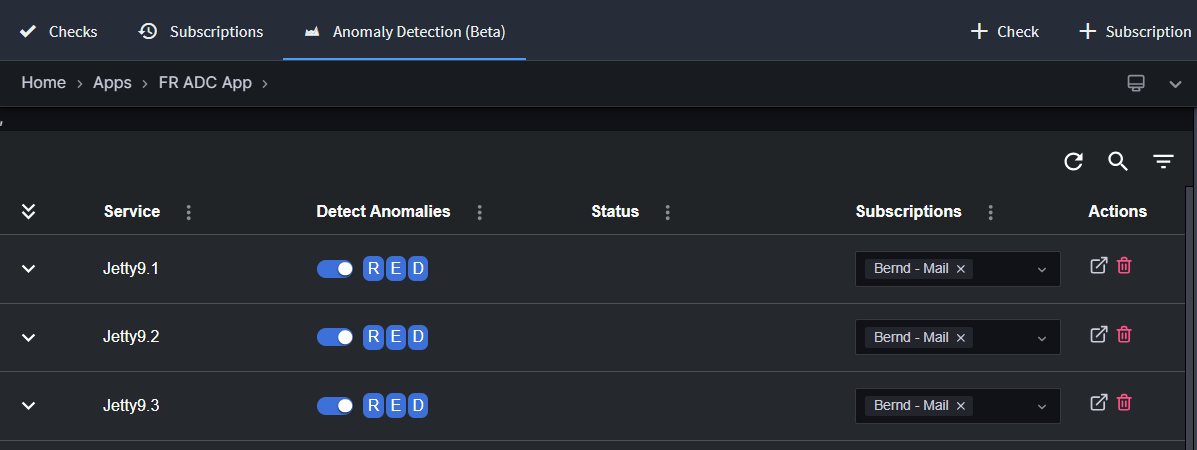
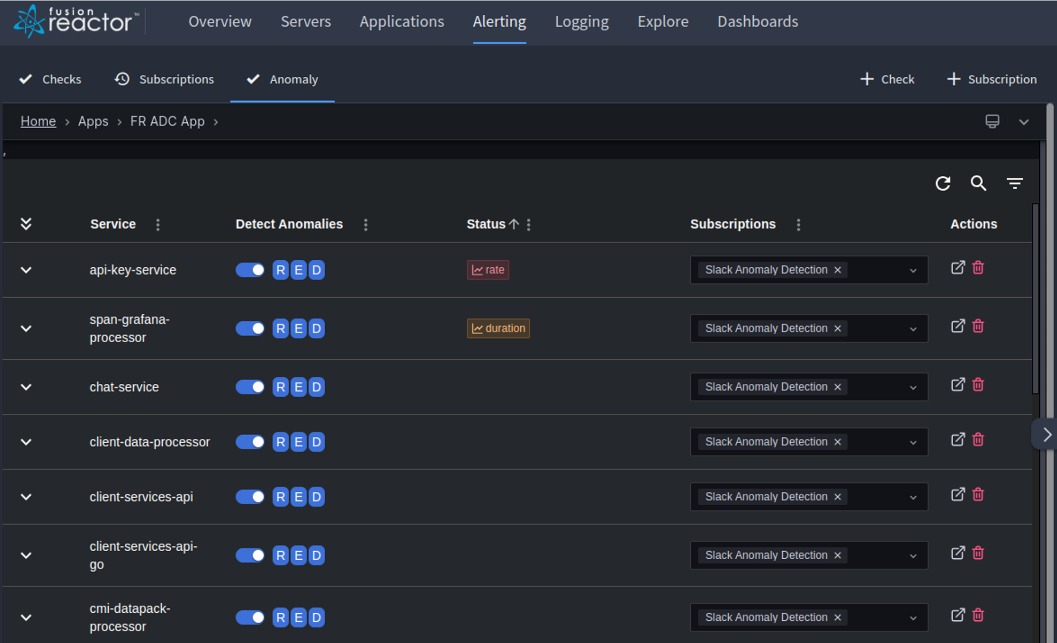
Service detection table
The services identified by the system are displayed in a table format. This table includes features that allow users to:
| Feature | Description |
|---|---|
| Filter services | Search for services by name. |
| Sort data | Organize the information by different column values. |
| Reload function | Reinstate the default settings, allowing the system to rediscover any new services or reintegrate services that were previously removed. |
Access to in-depth configuration
For each service listed, the following features are available:
| Feature | Description |
|---|---|
| Expand/Collapse Button | Situated on the left, this button allows you to view or hide additional configuration settings. |
| Service Name | This is shown adjacent to the expand/collapse button. |
| Anomaly Detection Toggle | Next to the service name is a switch for enabling or disabling anomaly detection for the three key metrics: Rate, Errors, and Duration, visible in the Detect Anomalies column. |
| Activation of Individual Metrics | The RED indicators, which can be clicked to turn on or off the respective metric queries, show their status with color coding: blue indicates active and gray indicates inactive. Anomaly probabilities are calculated only for active metrics. |
| Alert Status for Anomalies | Displays the present condition of the RED anomaly alerts for the service. An orange label signifies that the associated alert rule is in pending mode. A red label denotes that an alert has been triggered. |
| Subscriptions | Select from predefined subscriptions to determine where alerts for anomalies should be sent. |
| Actions | Located at the far right, this tab provides additional actions. The current options available are a link to open the Anomaly Alert Dashboard and Delete, used to remove a service from the list. |
Example screenshot showing the current anomaly alert status:
Customization of individual metrics
Each service within the system allows for separate configuration of its RED metrics. Default settings are provided, but they can be tailored for specific needs. In the detailed view of a service, you'll find tabs for Rate, Errors, and Duration, each offering unique settings for their metric queries (Active and Time Range) and notification parameters (Threshold and Duration).
| Setting | Description |
|---|---|
| Metric Activation Switch | This control, akin to the RED indicator, is used to turn the metric query on or off. |
| Choosing Time Range | Users have the flexibility to select the time frame of historical data to be used for anomaly detection, ranging from one hour to one week. This duration is dynamically updated in a continuous window. |
| Anomaly Threshold Adjustment | The slider allows you to set the anomaly probability threshold, with a range of 80% to 100%. |
| Setting Alert Duration | Define the required duration for which an anomaly must exceed your chosen threshold to trigger an alert. For example, an anomaly is recognized when its probability stays at or above a set level (like 95%) for a predetermined time (such as 4 minutes). |
Custom Detectors
FusionReactor Cloud now features Custom Detectors, enhancing its ability to identify anomalies in your application's performance. This powerful tool allows for tailored monitoring based on your specific needs.
Key points:
-
Custom Detectors require manual setup using PromQL.
-
Three pre-configured detectors are available for Java and ColdFusion users.
-
You can create your own detectors for any technology stack.
-
Monitor CPU, memory, or other critical resources.
Custom Detectors enable precise identification of performance issues, helping maintain your application's efficiency across various technologies.
Adding a Custom Detector
Step 1: Navigate to FusionReactor > Alerting > Anomaly Detection (Beta) > Custom Detector
Step 2: Select the ADD DETECTOR button and configure the Custom Detector settings as follows:
-
Enter a unique query label.
-
Set the aggregate.
-
Enter a PromQL expression.
-
Adjust the anomaly probability threshold according to your needs.
-
Select the Time Range and Pending For intervals.
-
Select from predefined subscriptions to determine where alerts for anomalies should be sent.
Step 3: Click the APPLY CHANGES button.
Step 4: Toggle the Anomaly Detection check to enable the Custom Detector.
Best practice for Anomaly Detection configuration
Understanding service-specific metric profiles
Each service you monitor with FR Cloud has its unique profile for Rate, Errors, and Duration metrics. The profile varies based on the duration selected for calculating anomaly probabilities, which can range from an hour to a maximum of one week. For effective anomaly detection, it's essential to tailor the configuration for each service by considering the following:
| Setting | Description |
|---|---|
| Time frame selection | Choose an appropriate time frame that reflects the service's operational patterns for anomaly probability calculations. |
| Threshold settings | Set suitable threshold levels for anomaly probabilities to minimize false positives and negatives. |
| Duration for threshold exceedance | Configure the minimum duration that the threshold level must be exceeded for an anomaly to be reported. This helps by filtering out transient spikes that may not be indicative of a systemic issue. |
Tips for optimizing Anomaly Detection
| Feature | Description |
|---|---|
| Historical data analysis | To determine the optimal Threshold and For values for anomaly detection, it is often useful to analyze the probabilities of a RED metric over an extended period, such as one week or even thirty days. This historical perspective can help identify the appropriate settings for a shorter period, like one day, ensuring that the detection is sensitive to true anomalies while ignoring normal fluctuations. |
The importance of tailoring settings
| Feature | Description |
|---|---|
| Uniform settings aren't always effective | Services differ in their operational conditions and behavioral patterns, necessitating individualized adjustments in anomaly detection settings. |
| Threshold settings | Set suitable threshold levels for anomaly probabilities to minimize false positives and negatives. |
| Need for regular review and modification | Anomaly detection in FR Cloud is an active process. Regularly reviewing and fine-tuning these settings is vital to align with changes in service behavior and usage patterns. |
Understanding and addressing these aspects will greatly improve the precision and effectiveness of FR Cloud's anomaly detection capabilities.
Need more help?
Contact support in the chat bubble and let us know how we can assist.