Response Codes
Request > Response Codes shows summary of all the response codes returned to the users of your server.
Below is an image of the Response Codes page overview.
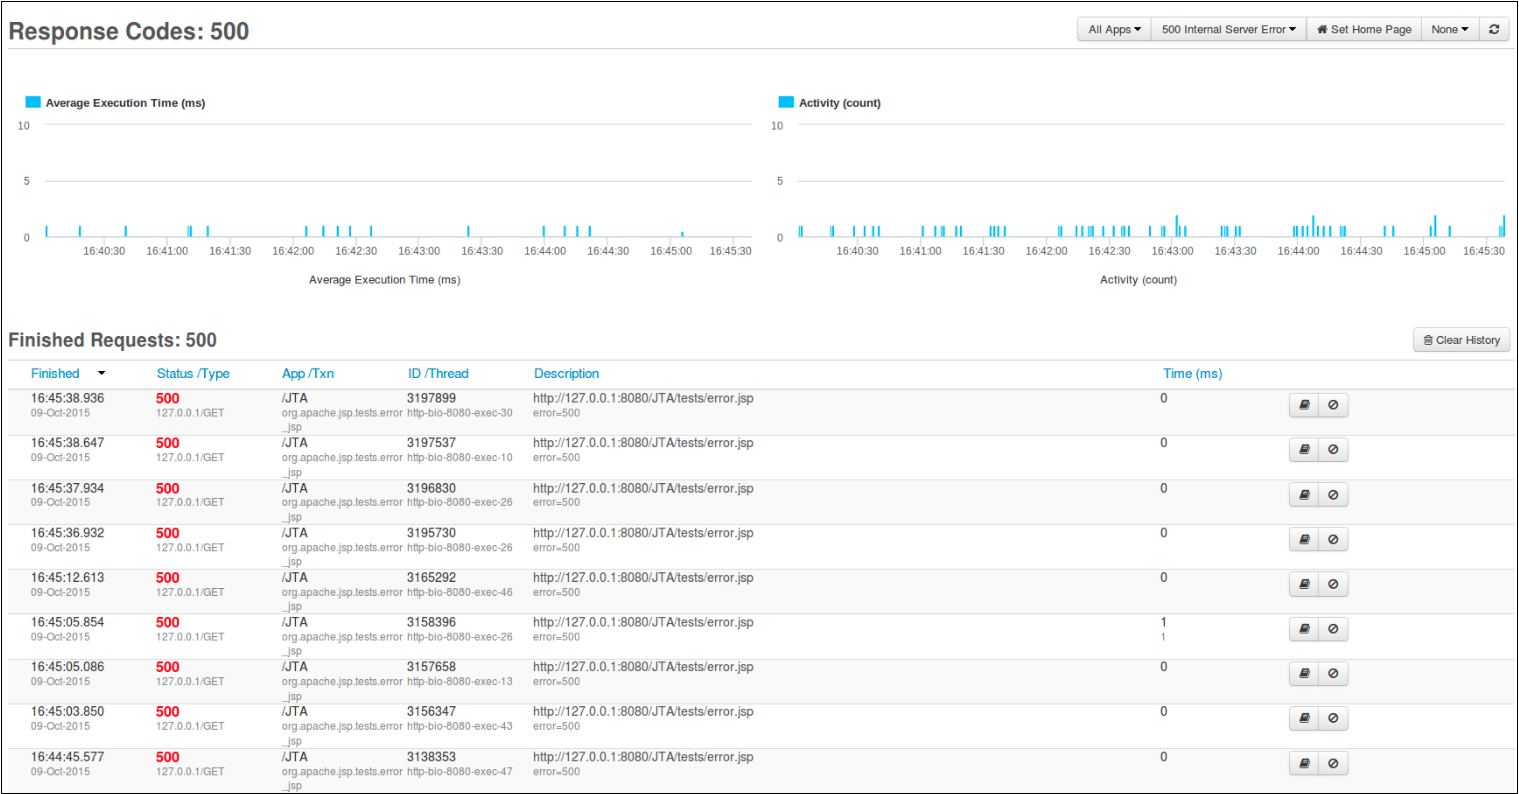
Activity Execution Time graph
Average Execution Time per minute of any requests that have a response code that matches the selected.
Tip
Placing your mouse pointer on a data point will show a tool-tip with details about that point.
Activity Count graph
This is the number of the selected response code that have occurred each minute.
Response Codes table
Below the graphs is a list of the requests that returned the selected response code. This list has the following columns:
| Name | Description |
|---|---|
| Finished | The date and time at which the request was completed. |
| Status / IP | The final HTTP return code of the request and the IP address of the caller. |
| App / Txn | The application the request is for and the transaction location. |
| ID / Thread | The request ID and the name of the thread which is servicing the request. |
| Description | The URL path of the response code. |
| Time ( ms ) | The time that the transaction took to complete. If available then you will also see the amount of actual CPU time that this transaction used below it ( In gray ) |
Managing Requests
Each request listed on this page has two icons next to it. They are:
| Button | Name | Description |
|---|---|---|
| :fa-book: | Details | Clicking this button will redirect you to the Details page for the selected JDBC transaction |
| :fa-ban: | Add to CP | Clicking this button will redirect you to the Protection Restrictions page which will be filled out for this request. |
Sorting Response Codes
You can change the order in which requests are displayed on this page by clicking on any of the column titles. Clicking on a title for a second time will reverse the order on that column.
There are filters present at the top of the page.
| Name | Description | Default |
|---|---|---|
| Apps | The application you wish to view | All Apps |
| Error Code | The type of response code you wish to view | 200 OK |
Need more help?
Contact support in the chat bubble and let us know how we can assist.