Profiler Example : loop.jsp file that reads each line from a file and prints the output.
The loop.jsp is a simple script that reads every line from an
existing file and prints out the result.
loop.jsp
<%@page import="java.io.FileInputStream"%>
<%@page import="java.io.File"%>
<%@page import="java.io.InputStreamReader"%>
<%@page import="java.net.URL"%>
<%@page import="java.io.FileReader"%>
<%@page import="java.io.BufferedReader"%>
<%@page contentType="text/html" pageEncoding="UTF-8"%>
<!DOCTYPE html>
<html>
    <head>
        <meta http-equiv="Content-Type" content="text/html; charset=UTF-8">
        <title>Read From a Text</title>
    </head>
    <body>
<%
String jspPath = "/opt/applicationservers/tomcat/apache-tomcat-9.0.0.M4/webapps/JTA/controls/";
String fileName = "myFile.txt";
String txtFilePath = jspPath + fileName;
BufferedReader reader = new BufferedReader(new FileReader(txtFilePath));
StringBuilder sb = new StringBuilder();
String line;
for(int i=0;i<1000;i++)

{
    for(int j=0;j<i;j++)
    {

    while((line = reader.readLine())!= null)
         {
        sb.append(line+"\n");
        }
    }
}
out.println(sb.toString());
%>
    </body>
</html>
Profiler Results Page
When the execution of the script has finished, go to the Profiled Thread History tab and see the transaction details. ( See screenshot below )

Lets take a better look of the transaction. ( See screenshot below )
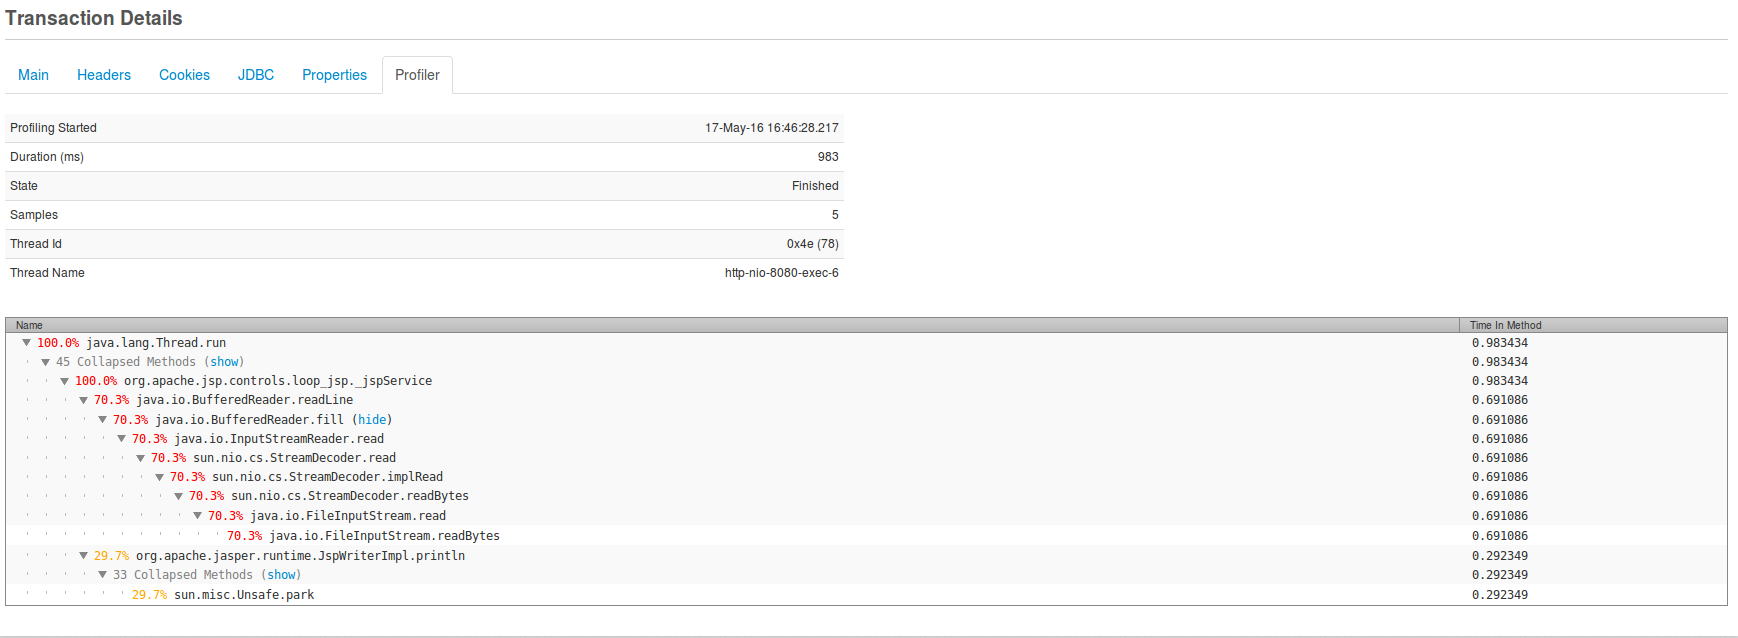
If we take a look in the Transaction details, we will be able to see
that the most consuming method is the java.io.BufferedReader.readLine
with 70.3% of the total
execution time. Therefore, we can assume that reading a number of lines
from a file inside a double for loop is not a good programming
practice. The rest of the execution time was consumed from printing the
lines of the file in the browser, and that method only consumed the
29.7% of the total time.