Memory
FusionReactor 7 adds support to view what objects are using the most memory on the application server. This shows 'live' objects on the heap and allows the GC paths (garbage collection paths) to the GC Roots which is keeping the objects live.
The view heap allows the current objects to be view. From the view heap UI (ie. live heap view) the user can access the GC Roots page to see why these objects are being kept live.
The snapshots page allows snapshots of the heap to be take which can then be diff-ed to a earlier or later version.
View Heap
FusionReactor can show you the status of the various memory spaces available in your Java engine. The memory heap space is useful to show you the overall state of memory, but is not accurate enough to detect if your application is leaking or not. Finding memory leaks is quite challenging, but this is where FusionReactor offers the capability to perform in-depth-profiling to assist you.
If you are running FusionReactor Ultimate, Developer Edition or the free trial, then you will have access to the Heap Histogram which you can find under the Memory tab.
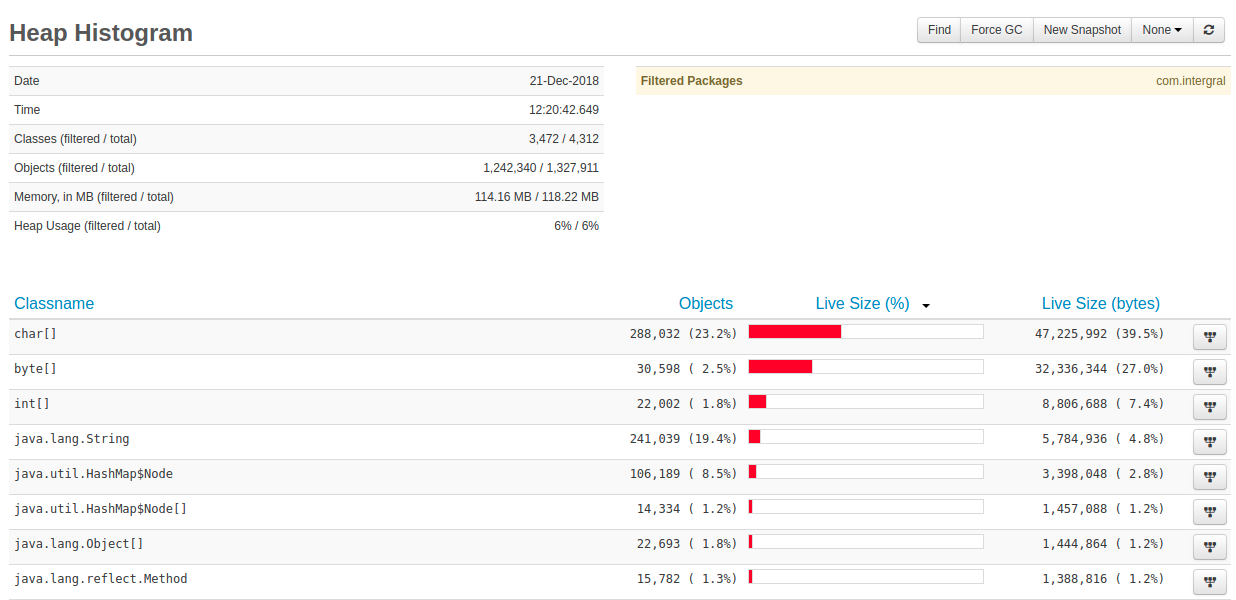
The view heap page shows a profile of the Java Heap. This feature is useful for spotting issues related to large numbers of objects being created within a specific class, as well as potential memory leaks. You can configure the refresh rate of this page to perform heap snapshots at as low as 1 second intervals.
It defaults to show objects based on the type of objects using the most memory.
If you set the Refresh Rate at the top right hand side of the screen, you will see the heap utilization bound to the Classes’ and associated objects growing and shrinking as your application(s) execute.
What you’re looking for here is delta’s of the number of objects created/memory utilized whilst executing some particular application procedure. If you know that after that procedure has executed, your allocated objects will be released – then the delta should highlight any potential memory anomalies.
Basic Process
To get the best results we recommend you follow the following steps for capturing delta’s and analyzing memory :
- Firstly force a GC by clicking the Force GC button at the top of the page
- Take a snapshot of the heap, by clicking on the New Snapshot button
- Then start you application procedure (one or more times)
- Click the Refresh icon to reload the heap histogram
- Take a snapshot of the heap, by clicking on the New Snapshot
Heap Histogram Page
The page shows the following :
- In the top left shows information about the time the page was generated, the number classes and objects scanned (and if any of these have been hidden due to filters)
- The top right has buttons to search/find the heap for a specific class name or substring of the class name. It has buttons to Force a Garbage Collection (Force GC) operation as well as the ability to trigger a new snapshot. (See Snapshots)
- The lower part of the page shows the table of unique classes, the number of live objects and the size these objects take up on the heap. Sorting can be performed on any of these columns. On the right of each row is a button to view the Garbage Collections roots for the specific class. When you click this button FusionReactor will find out what is keeping these objects live. (See Garbage Collection Roots)

Filtering

The heap histogram pages can filter specific java packages. By default FusionReactor excludes its own code (com.intergral).
You can use this filtering (via Memory Settings) to hide packages you know are good and reduce the pages to show your packages or frameworks code only.
When package filtering is enabled the table at the top left of the page shows how many objects and classes were found and how many are being shown after the filter has been allied.
Find
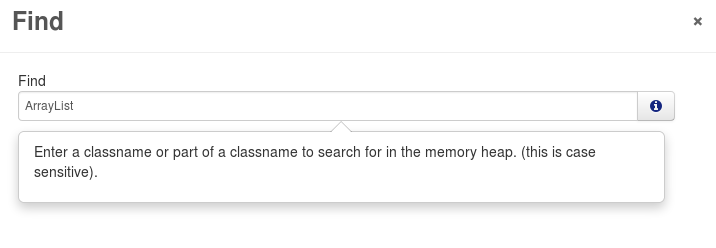
The find feature allows the user to search for a specific string or substring of the classname.
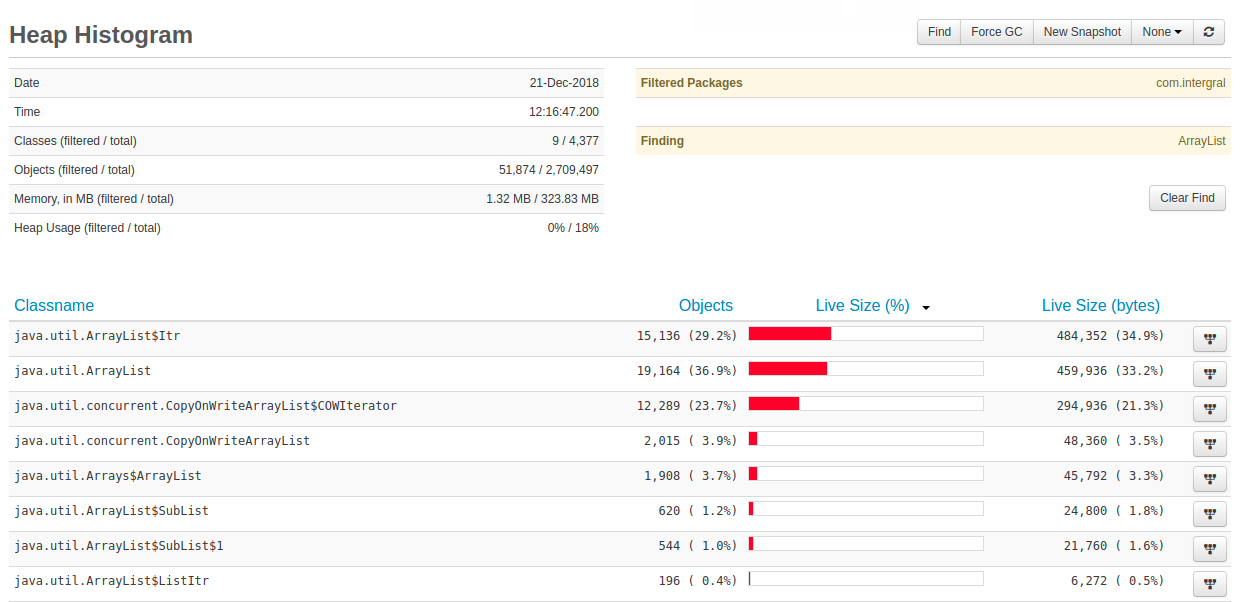
E.g.Press the find button enter ArrayList and the heap histogram page will only show classes which contain the string ArrayList :

Once you press Confirm to trigger the find, the UI will change to show something like this :
To remove the Find restriction you can simple press the "Clear Find" button to go back to the full view.
Garbage Collection Roots
When viewing the heap view of the live java heap in FusionReactor its possible to press the GC Roots button (on the far right of the UI). This button shows a page which shows why a specific object is being kept 'live' and not being garbage collected.
In the example below the page is showing char[]. The page shows that there are 171,778 char[] in the heap, when the page ran, using 21,880,994 bytes of memory. These char[] are mostly being kept live by java.lang.String which is responsible for 83.1% of all the char[]s on the heap.
The screen shot below shows that there are java.util.HashMap$Entry classes which have a field called key, which are keeping 23.2% of the char[] live but not directly. The HashMap Entries have a key field with is referencing a java.lang.String. These String classes have a field called value which is actually keeping the char[] live.
 You can expand each node to navigate to the GC root path to find what is
keeping these objects live.
GC Roots are one of the following :
| Fusion Reactor label | JVMTI constant | Description. |
|---|---|---|
| JNI Global | JVMTI_HEAP_REFERENCE_JNI_GLOBAL | JNI global reference. |
| System Class | JVMTI_HEAP_REFERENCE_SYSTEM_CLASS | System class. |
| Monitor | JVMTI_HEAP_REFERENCE_MONITOR | monitor. |
| Stack Local | JVMTI_HEAP_REFERENCE_STACK_LOCAL | local variable on the stack. |
| JNI Local | JVMTI_HEAP_REFERENCE_JNI_LOCAL | JNI local reference. |
| Thread | JVMTI_HEAP_REFERENCE_THREAD | Thread. |
| Other | JVMTI_HEAP_REFERENCE_OTHER | other heap root reference. |
See http://docs.oracle.com/javase/7/docs/platform/jvmti/jvmti.html#jvmtiHeapReferenceKind for more detailed documentation.
The key parts of this UI are the following :
- The reference path to a gc root - this path shows the classes and fields which are referencing the search class (like char[] above). As the user navigates deeper down the tree GC Roots will appear describing what is keeping something alive.
- The Retaining Quantity - The number of the search class (char[]) that the reference (on the left) is keeping live
- The Retaining Size - The size of the search classes (char[]) that the reference is keeping live.
Heap Snapshots
The heap snapshot page is very similar to the live view but instead of showing live information it captures the heap information and persist this into a file on disk.
When you first come to the Heap Snapshot page it will be empty, but you can simply press the New Snapshot button to create a new snapshot. Once its generated it will appear in the snapshots table, like below:

From this snapshots table, you can view the snapshot by pressing the

You can edit the name of the snapshot using the  button. This name is fairly restricted as it is also the filename of
the snapshot on the disk (normally inside the <instance>/heap
directory)
You can delete the snapshot by pressing 
View
When you view a heap snapshot the UI is the same as the Heap View page.
You can filter packages and use the find functionality to track down a specific classname or classnames.
Diff
Once you have more than 1 snapshot you can perform a diff between the two.
Simply select the blue check box on 2 snapshots and press Diff Selected at the top of the snapshots page and the diff results will appear.
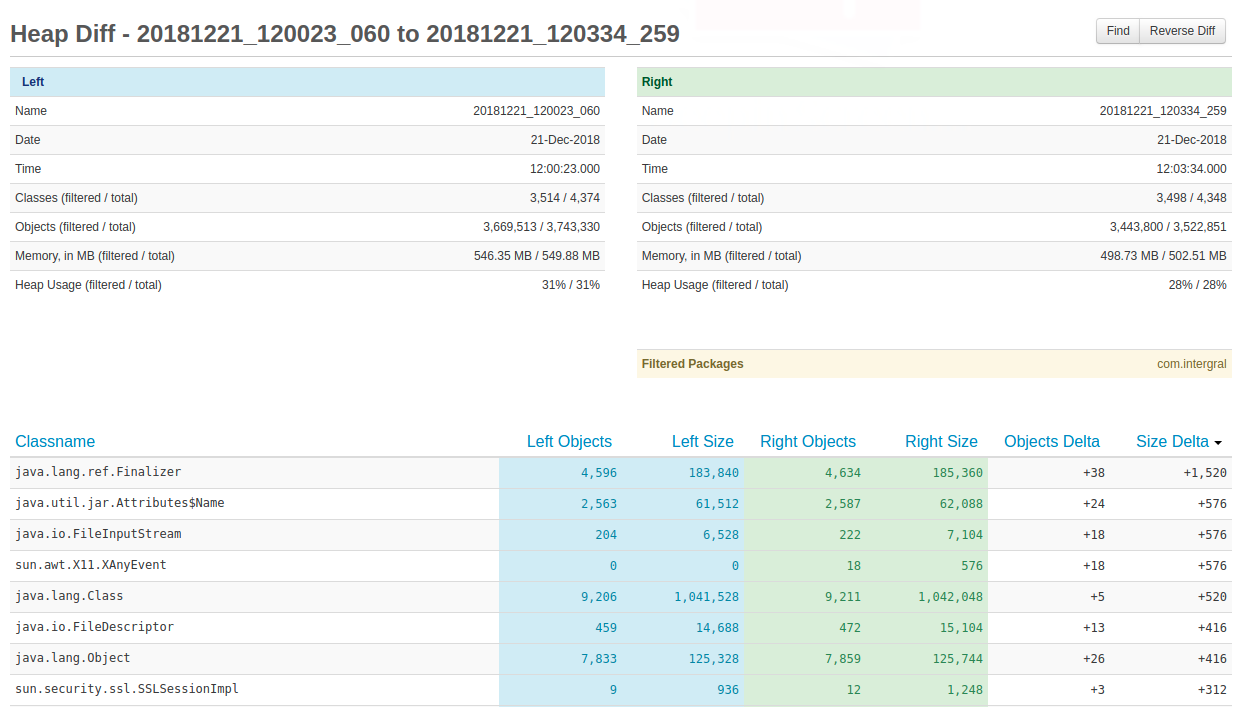
The diff page shows a 'left' and 'right' snapshot and shows the delta. You can press the Reverse Diff button on the top right to switch the order of the 2 snapshots.
The top 2 tables shows the information about the individual snapshots (the same as Live Heap + Heap Snapshot views). The package filtered and find features also work fully on the diff page (see Heap View)

The lower part of the page shows the actual diff of the snapshots.
There are columns for the left and right snapshots. Both are color coded (blue for left, green for right). For each snapshot the objects and size of the these objects are shown.
The diff part of the UI is the last 2 columns. The Objects Delta column shows how many more objects there are in the right, compared to the left. The Size Delta column shows how much more memory the right snapshot is using for a specific classname compared to the left.
Sorting of the diff defaults to Size Delta column which means that whatever is the top line in the lower table is using more memory in the right snapshot compared to the left.