FusionReactor dashboards
FusionReactor Dashboards are interactive visual representations of key metrics and data related to your application's performance. The dashboards display real-time data in a way that is easy to understand and interpret, allowing you to quickly make informed decisions about the health and performance of your applications.
Benefits
-
Improved performance monitoring: FusionReactor dashboards provide real-time data and metrics that can be used to monitor the performance of your applications and identify any potential issues before they become critical.
-
Increased efficiency: By displaying information in a clear and concise way, FusionReactor dashboards help you to quickly understand the health and performance of your applications, reducing the time and effort required to gather information.
-
Infinitely customizable: FusionReactor dashboards can be tailored to meet the specific needs and requirements of your applications, allowing for the display of only the most relevant data.
Types of FusionReactor dashboards
There are several types of FusionReactor dashboards available, including:
-
Integration dashboards: Observe metrics to monitor the health of your entire infrastructure, with metrics from all aspects of your application stack. FusionReactor has provision for the following integration dashboards: MySQL, MSSQL, Node exporter, NGINX, NGINX Plus and more.
-
System dashboards: Provide an overview of the performance of your entire system, including metrics such as system utilization, memory usage, and response time.
- Application dashboards: Focused on the performance of individual applications, including real-time metrics such as request processing time, error rates, and server utilization.
-
Database dashboards: Designed to give a detailed analysis of the performance of your database, including metrics such as query performance, connection pool utilization, and database response time.
-
Logging dashboards: Give you preconfigured, powerful views which you can use to analyze your log data.
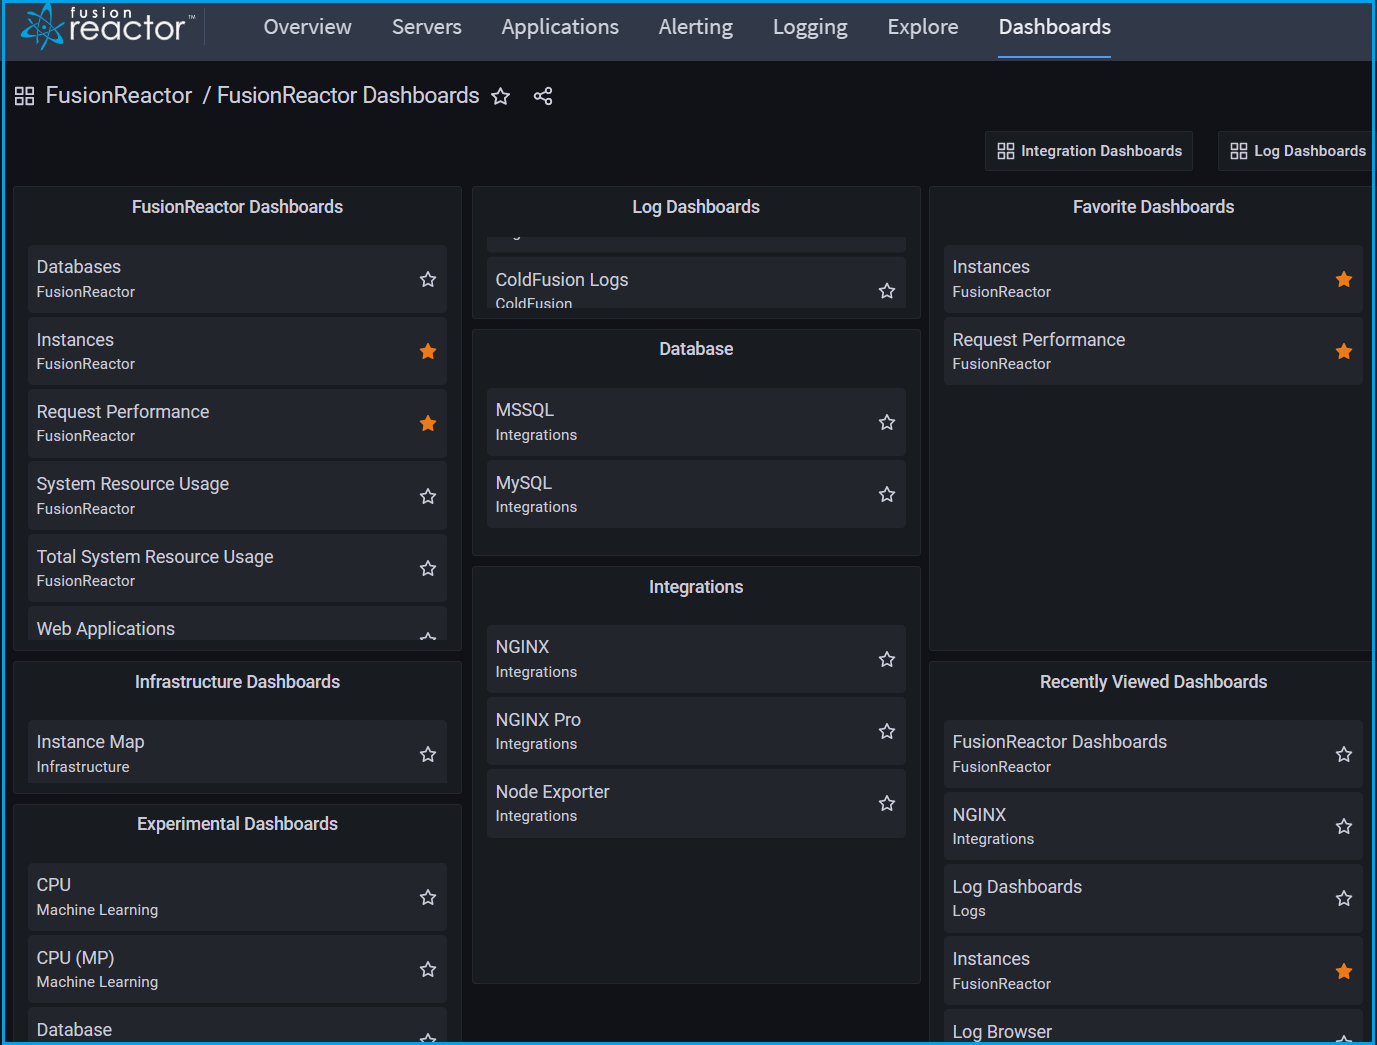
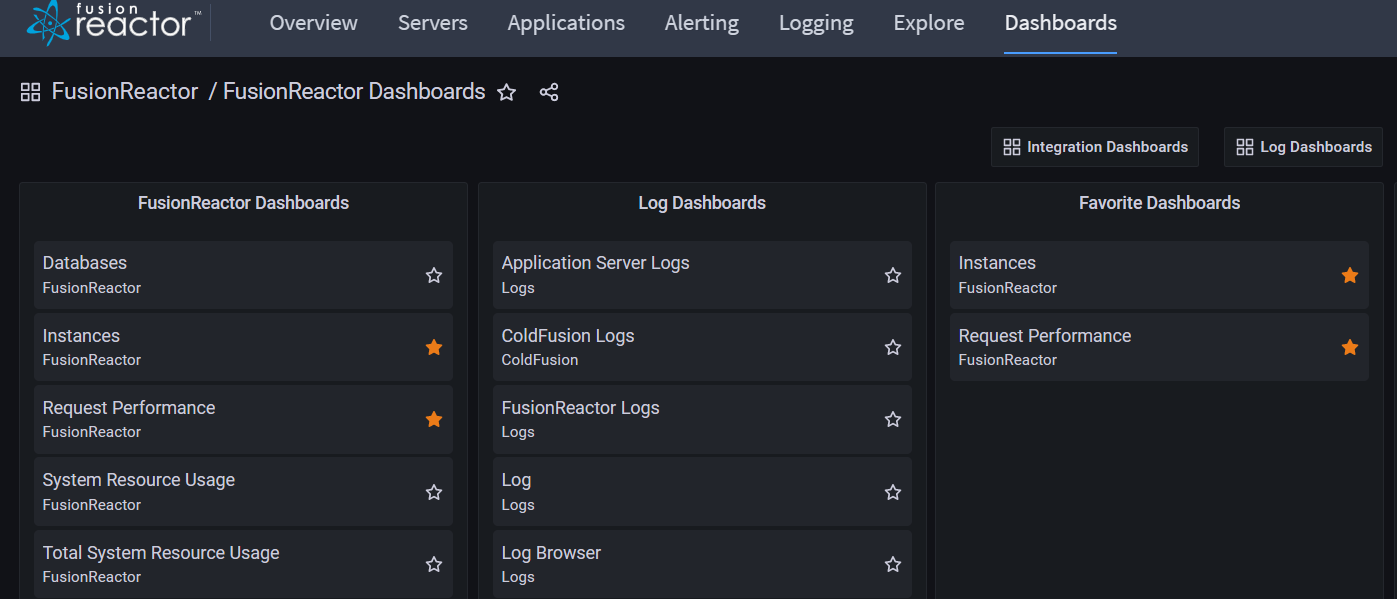
Using Dashboards
🔎Find it: FusionReactor > Dashboards
Navigate to individual dashboards from the new Dashboard tab of FusionReactor Cloud.
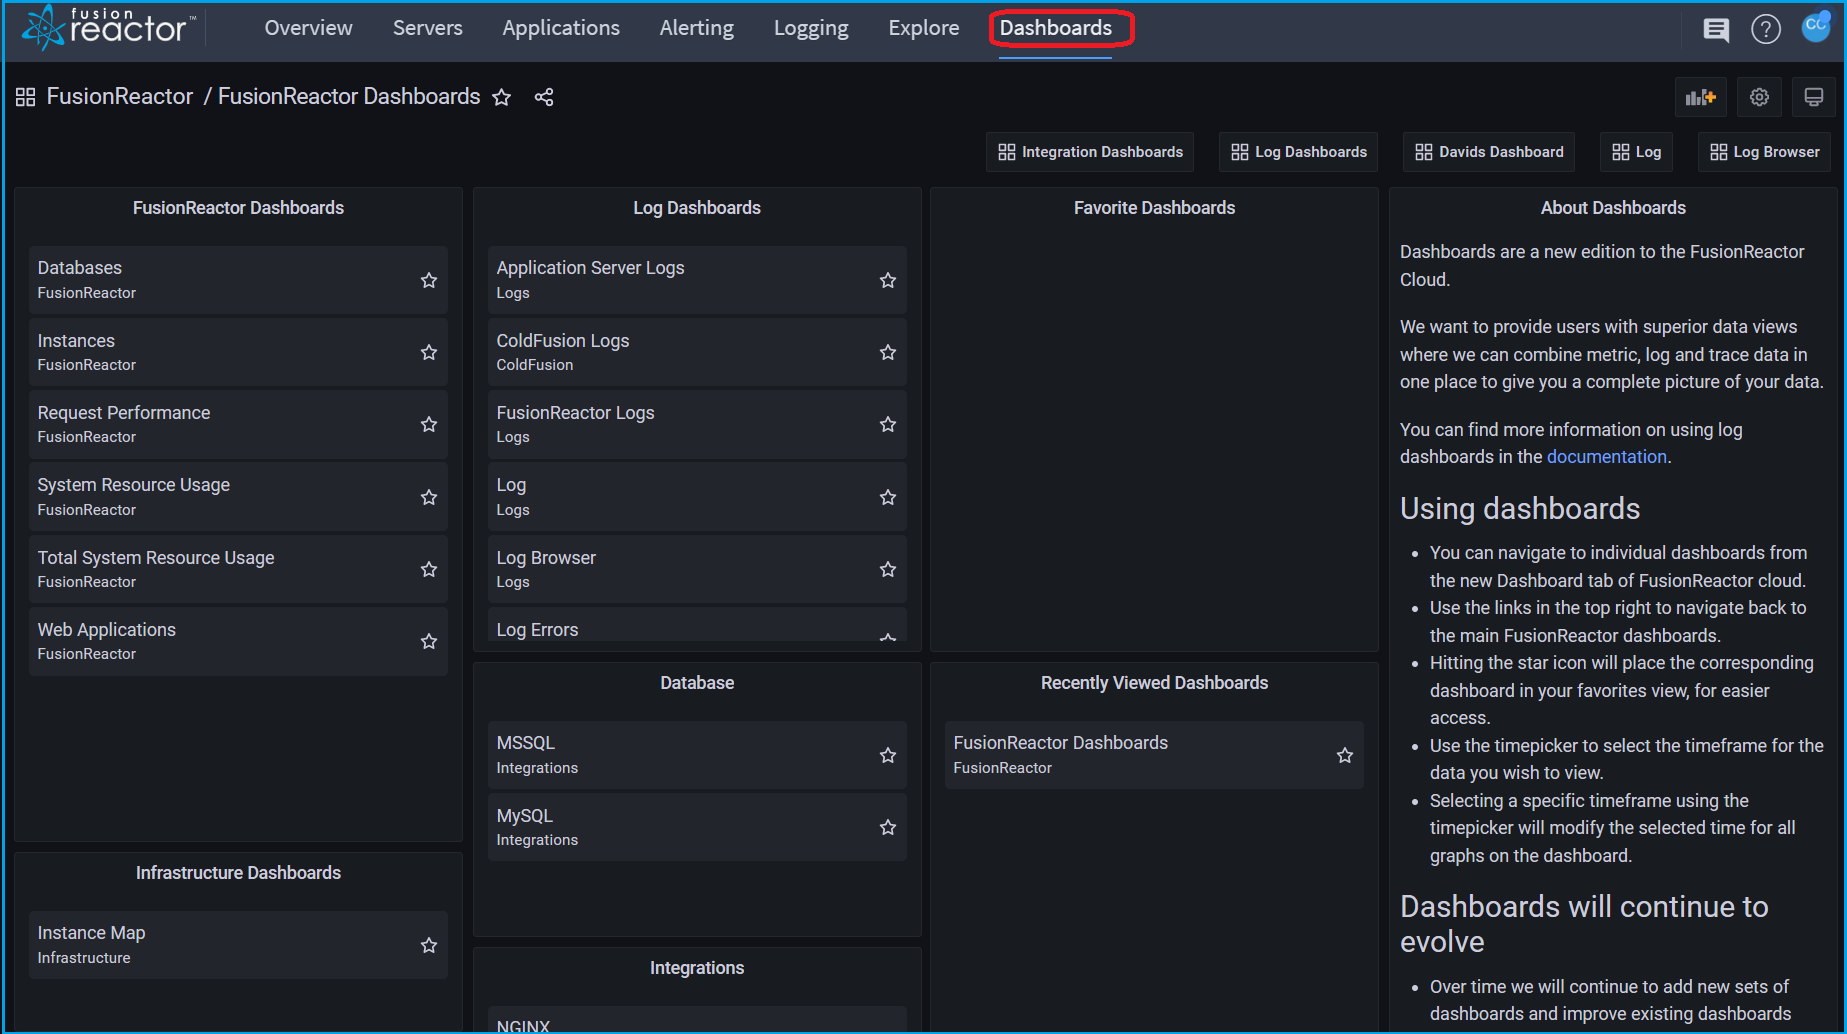
Use the links in the top right to navigate back to the main FusionReactor dashboards.
Tip
Selecting the star icon will place the corresponding dashboard in your favorites view, for easier access.
Time picker dropdown
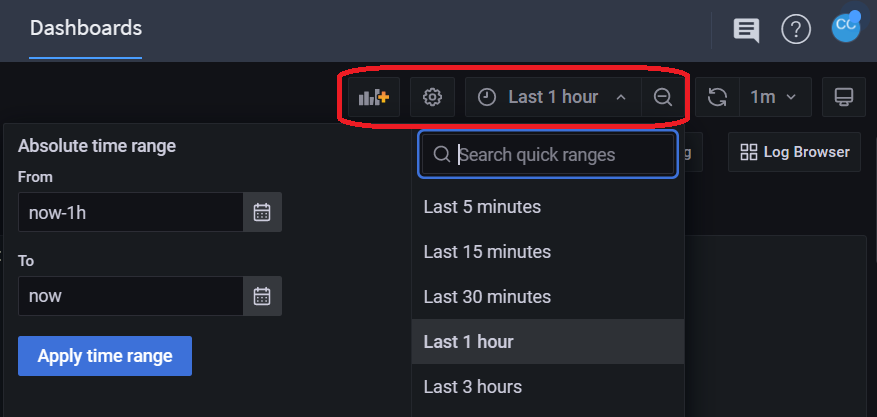
-
Use the time picker dropdown to select the time frame for the data you wish to view.
-
Click to select relative time range options and set custom absolute time ranges.
-
Change the time zone and fiscal year settings from the time range controls by selecting Change time settings.
-
Select the Zoom out icon to zoom out the time range.
Note
Selecting a specific timeframe using the timepicker will modify the selected time for all graphs on the dashboard.
Dashboard evolution
Over time, we will continue to add new sets of dashboards and improve existing dashboards that have been provisioned to your account.
Info
Some dashboards have been marked as experimental, this allows us to continually roll out new concepts for dashboards. These dashboards may contain issues, as we continue to refine and develop them.
Delve deeper with Explore
Within Explore you can view all metrics, logs and traces (transactions) ingested into your cloud account.
Here you can create new data views and filter data in any way you require.
Example
- Searching for traces using a transaction ID.
- Searching for traces with a specific URL.
- Viewing and processing any metric ingested into your FusionReactor Cloud account.
- Creating customized log filters to view ingested log data.
Learn more
Feedback
We welcome your ideas for enhancements and new dashboards going forwards. To provide feedback please use the chat feature within the cloud.